Tools
These are various tools I have made over the months. I have recently gone through to update many of them, and you can see the dates of these updates next to each link.
The Complete Pitch MovemeNT Tool
This tool has it all, but as a result it is a big file that takes some time to load. You'll need to be patient and allow it to load, but I promise it is worth it. The main image shows horizontal and vertical movement for each pitch thrown between 2015 and 2016. There are filters for pitcher name, release point, pitch speed, pitch type, spin rate, exit velocity, launch angle, batter handedness, pitcher handedness, and pitch result. That's a lot of filters!
Last Updated 2/25/2017
Home Run Calculator
A calculator I've made to estimate the likelihood of a ball with given an exit velocity and launch angle registering a home run. As you go left to right you odds of a home run with a given velocity, then again with the velocity and the given vertical launch angle, and then again with exit velocity, vertical launch angle and horizontal launch angle. The calculator automatically rounds the input numbers.
Often Updated Daily
Pitch Spin Rate and Movement Tool.
This tool allows you to select as many or as few pitches as you're interested in comparing. The tool with calculate the average spin rate and movement in both the x and z directions.
Last Updated 11/16/2016
Pitcher Specific Pitch Spin Rate and Movement Tool.
This tool is nearly identical to the other pitch spin rate and movement tool, except you can specify individual pitchers.
Last Updated 11/16/2016
Vertical Launch Angle and Value Tool.
The data used to create this chart is outdated. xOBA, which is used to measure value in this case, has undergone several iterations and improvements since this chart was created. Regardless, you can see how certain launch angles change value with respect to individual ball parks, batters, and pitchers.
Last Updated 5/19/2016
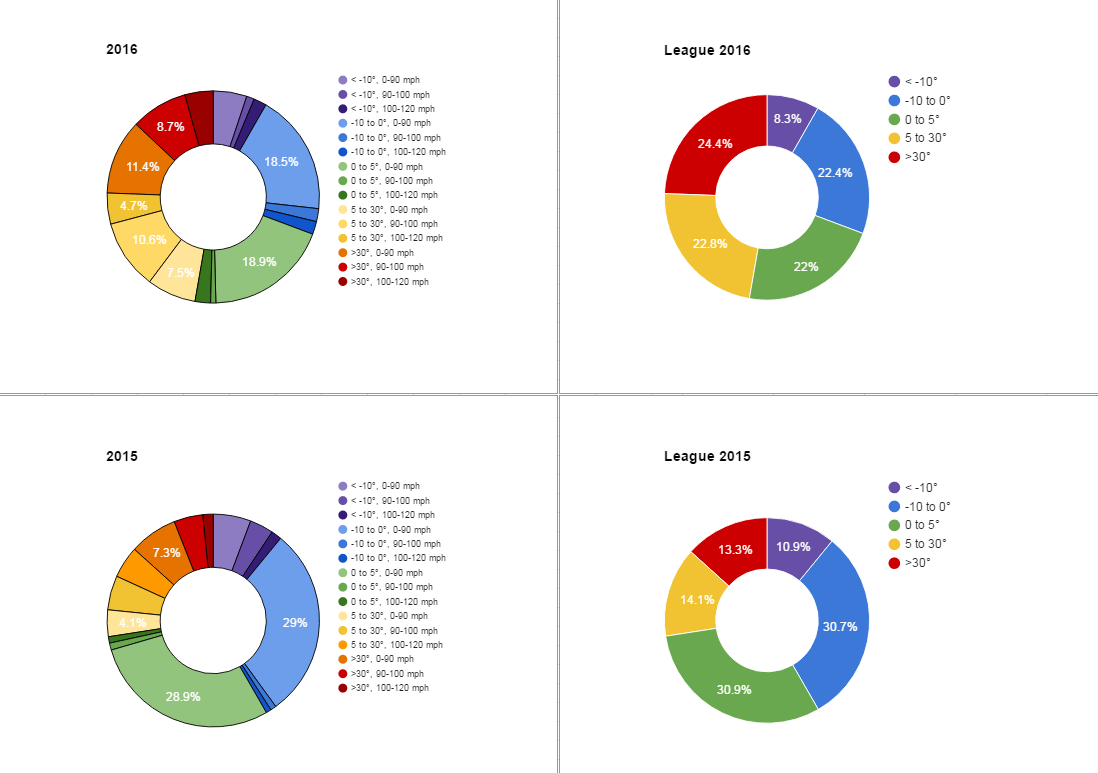
Launch Angle and Exit Velocity Donut Charts For Batters And Pitchers
The data used for these charts is also outdated, but it provides data from both 2015 and a large fraction of 2016 in a visually appealing manner.
Last Updated 4/24/2017
Batted Ball Value By Pitch Zone Charts
You can see how vertical and horizontal launch angle along with average exit velocity and value hit rate changes with pitch zone.
Last Updated 2/13/2017


